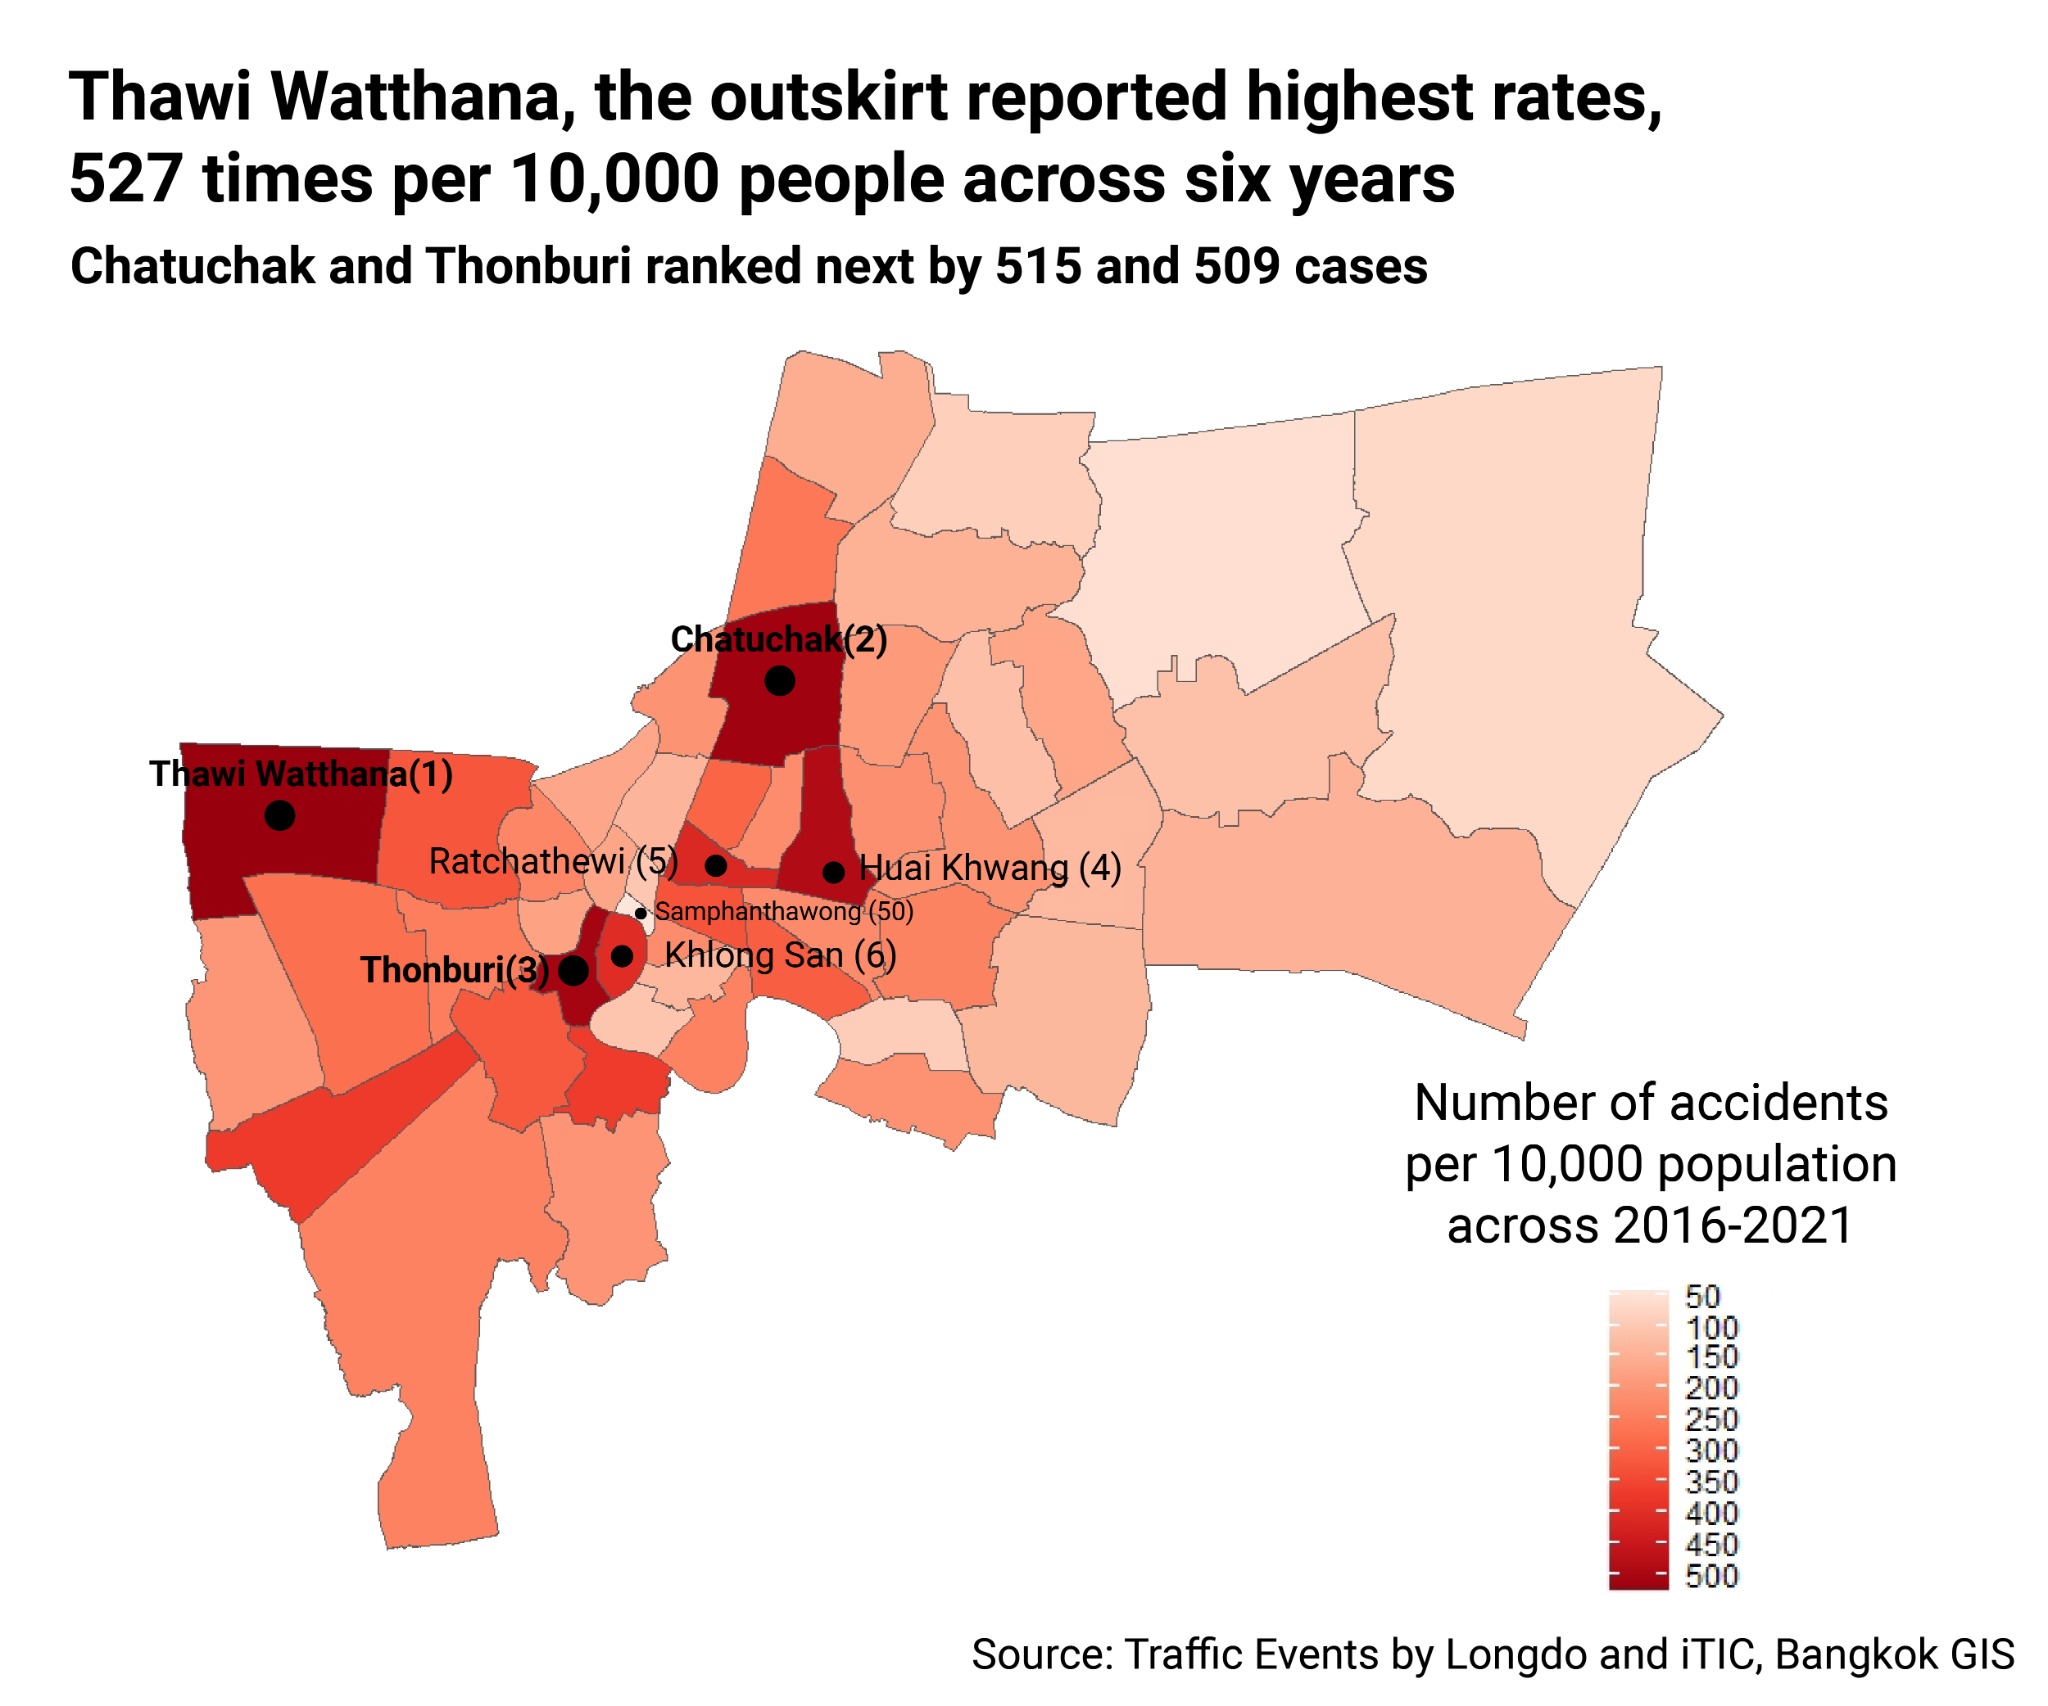
Thawi Watthana, outskirt of Bangkok reported highest in accident rate per population, while downtown Chatuchak, ranked second from 2016-2021
Seven out of 50 districts reported increase in average accident rates per year from pre-pandemic amidst overall drop due to lockdowns
Pitch Memo
The Covid-19 outbreak had impacted cities’ mobility around the world, including Bangkok, the capital of Thailand. Although it is known for severe traffic jams among global cities, the city’s multiple lockdowns and work-from-home trend pushed the cities’ traffic accident rates to become lower in the past two years.
An analysis of five years of Bangkok road accident data shows that new danger zones have emerged as traffic patterns shifted during the pandemic. While Bangkok as a whole experienced fewer road accidents during the pandemic, seven of the city’s 50 districts saw their accident rates jump after the COVID-19 outbreak, according to an analysis of accidents reported to the Intelligent Traffic Center Foundation and Longdo.
The overall decreasing trend can be confirmed as Longdo analyzed another dataset from the Ministry of Public Health, reporting that the number of deaths on road in 2020 decreased to lowest at 12,618 from the range between 19,000 to 22,000 deaths in the past ten years.
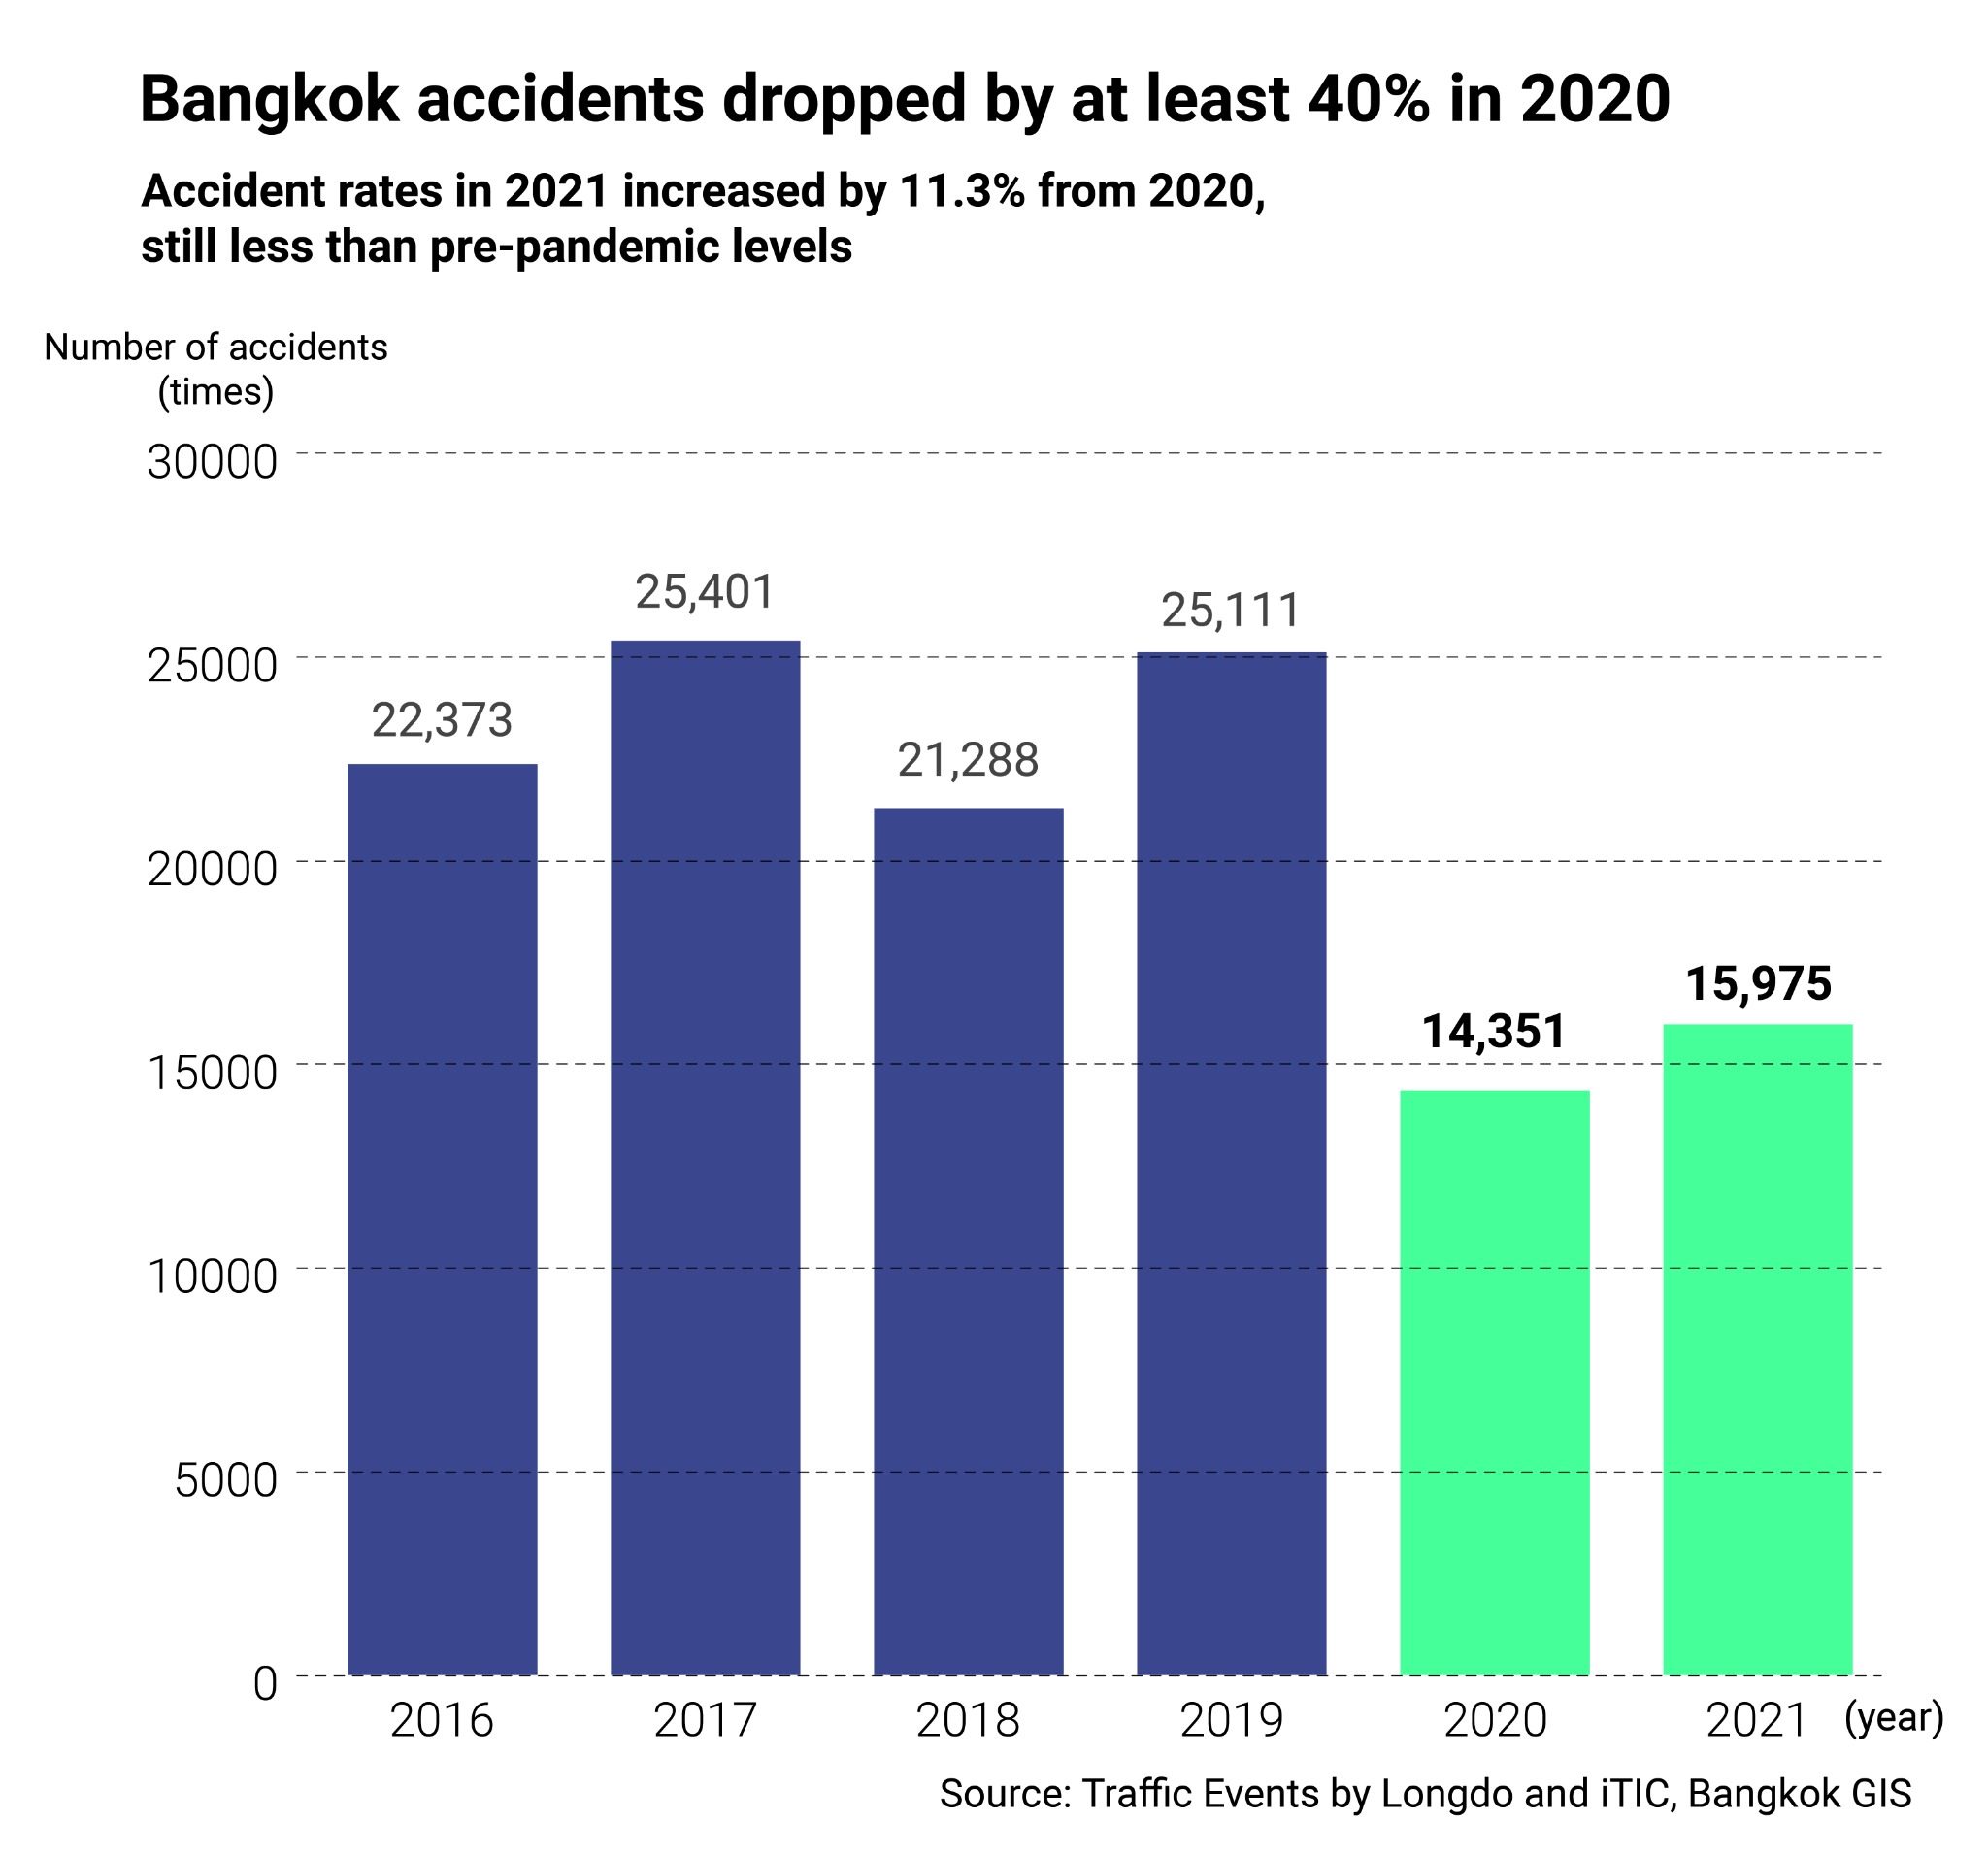
Sopon Patipatpanyakul, a staff at Poh Tek Tung, a traffic accident rescue non-profit organization said Bangkok accidents in the last two years had dropped because of the disease control policies that prevent people to travel across provinces and leave home at a specific time, along with the temporary pubs and bars close down, and the cancellation of Song Kran festival.
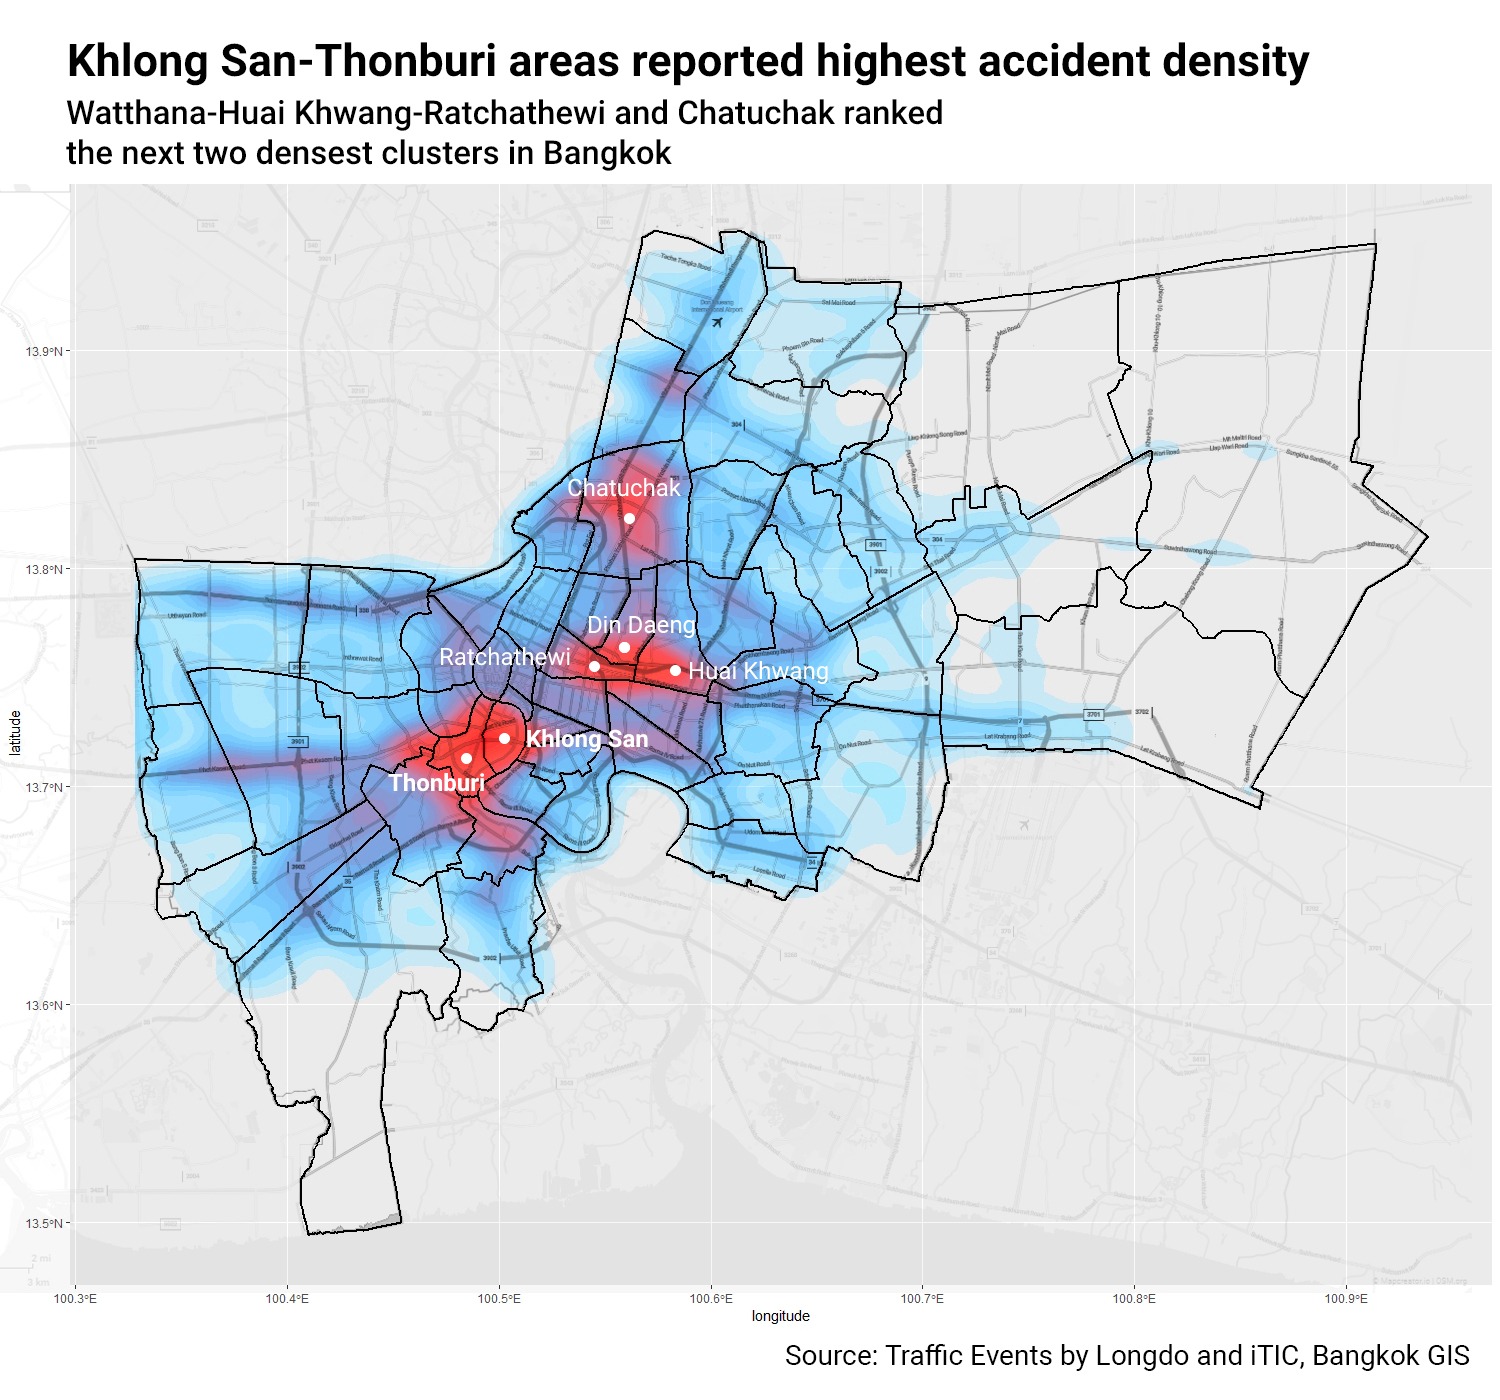
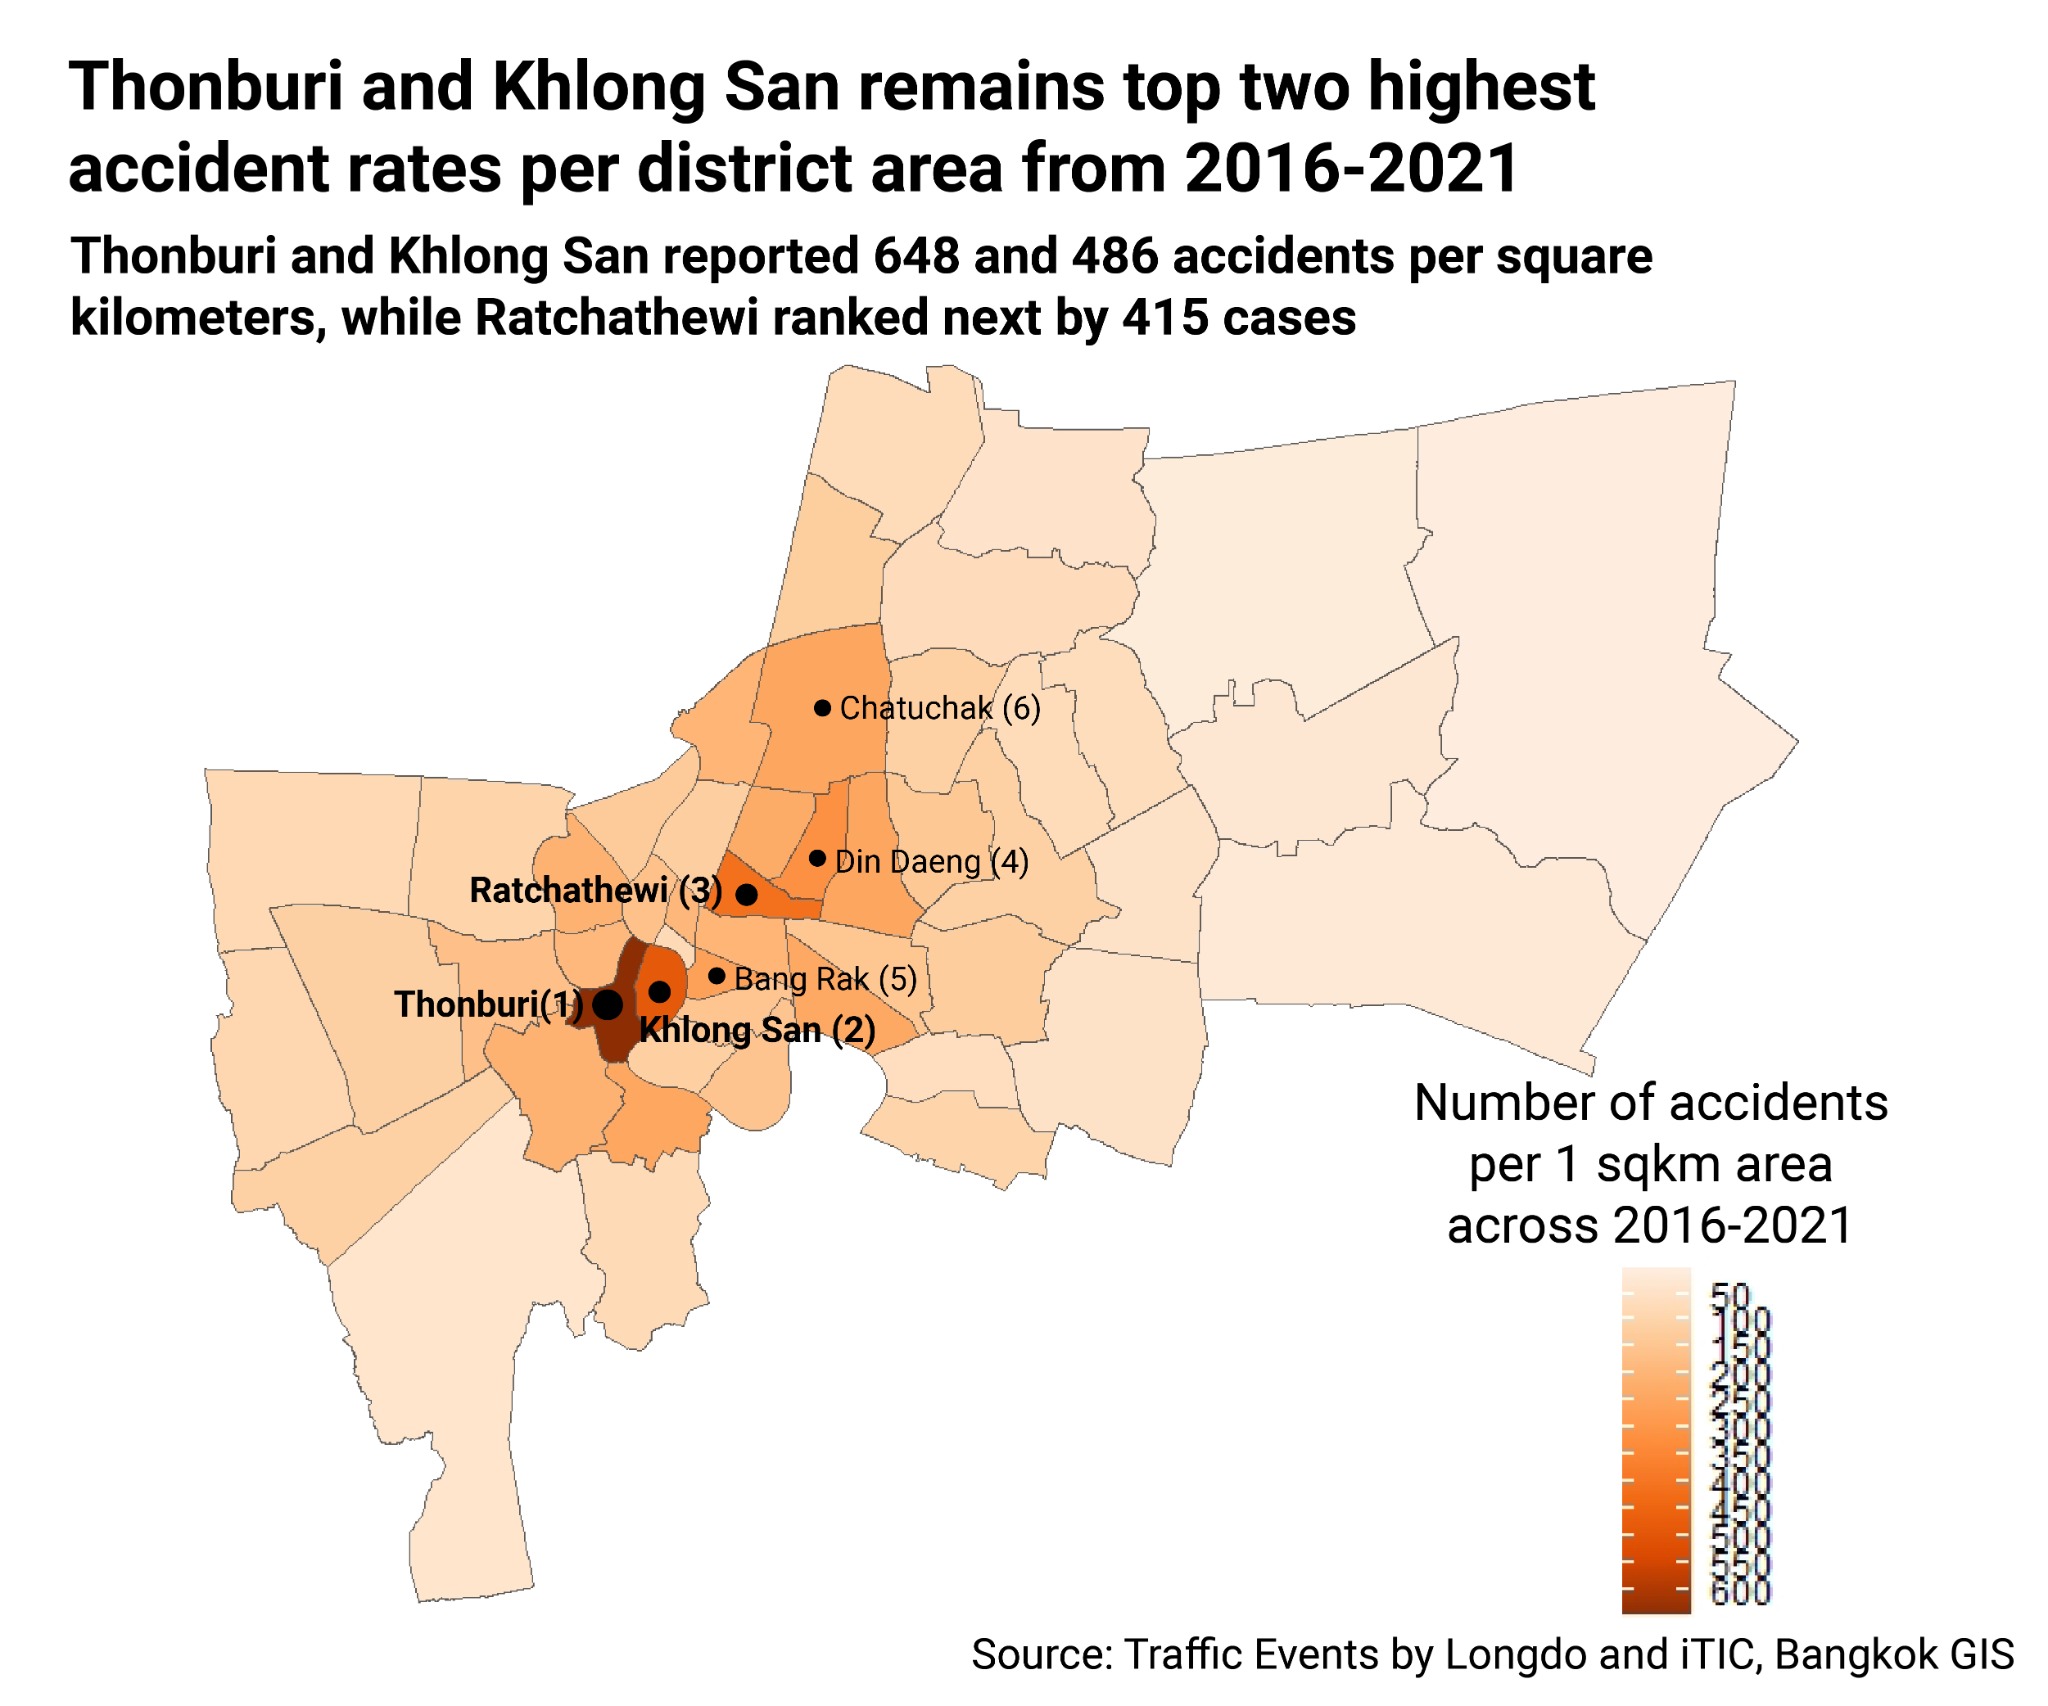
This project further looked at the trend of accident rates in Bangkok across 50 districts among the past six years. The analyzed heat map shows a density of accident rates, calculated from 2016 - 2021. We can see that the area with the densest accidents, highlighted in red, is Khlong San-Thonburi. The next two clusters in ranks are Watthana-Huai Khwang-Ratchathewi, and Chatuchak. All clusters are shaped along main roads.
However, looking deeper, data analysis shows that the top three districts with highest total accident rates from 2016 to 2021 are Thawi Watthana, Chatuchak, and Thonburi. There are 527, 515 and 509 accidents per 10,000 populations consecutively reported. Meanwhile, Samphanthawong reported the least, 45 cases per 10,000 people.
Sirima Cosavanitkit, 67, a rice shop owner who lives and runs her business in Chatuchak expresses her concerns by phone. “Thai people drive so carelessly, especially motorcycle riders. I got used to it,” said Sirima. “I blamed people's driving habits more than environmental factors.”
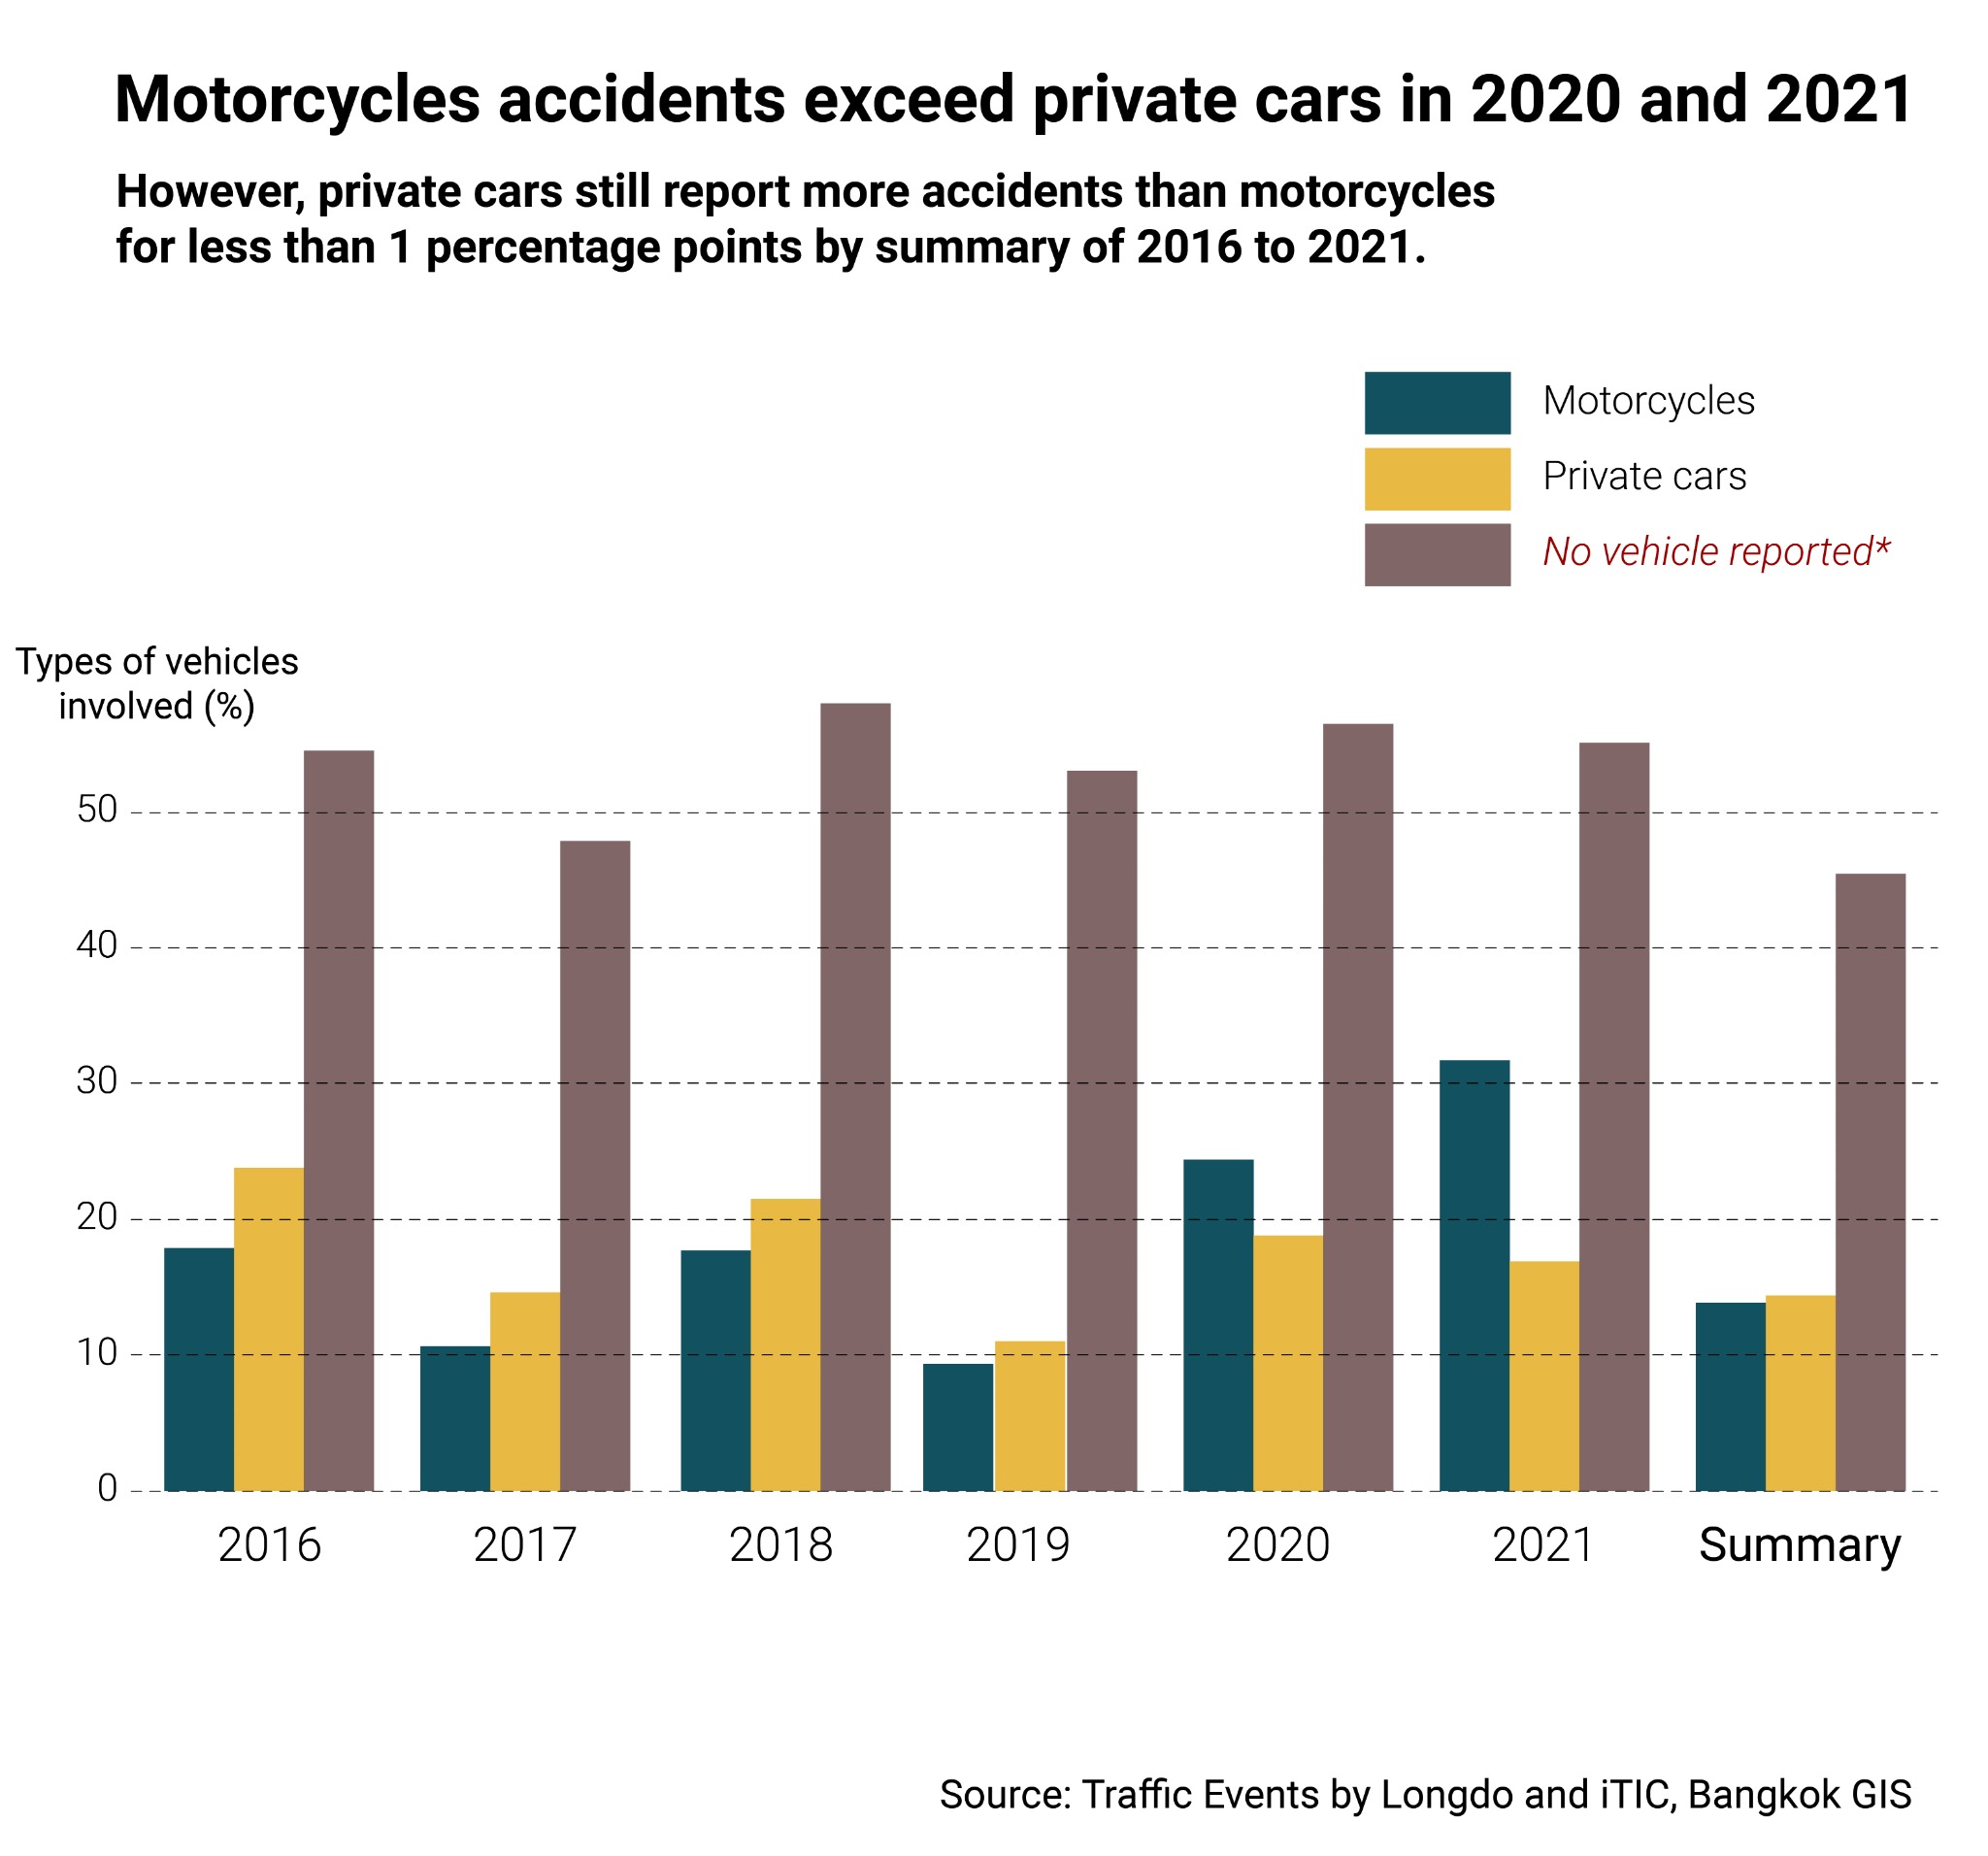
Data analysis of accident reports from 2016-2021 shows that 18.5% of the cases involved motorcycles, while 19.2% involved private cars. However, 60.6% of the cases did not report vehicle types. However, motorcycle accidents exceed private cars in 2021 and 2021, by 5.6 percentage points and 14.8 percentage points respectively.
On the other hand, data analysis across six years focusing on accident rates per district size, shows that the top three highest are Thonburi, Khlong San and Ratchathewi. There are 648, 486 and 415 cases per 1 square kilometers reported consecutively. Meanwhile, Nongchok reported the least, 5 cases per 1 square kilometers.
Nattakarn Wongratanakulthon, 26, a self-employed woman who lives and spend most of her daily life in Khlong San said she believed the high accident rates in Khlong San might be because there’s a lot of alleys along the main road, Charoen Nakorn from her car driving experience.
“If there’s a person driving out of the alley to the main road, either turning left or right, other cars that come straight can easily crash,” said Nattakarn.
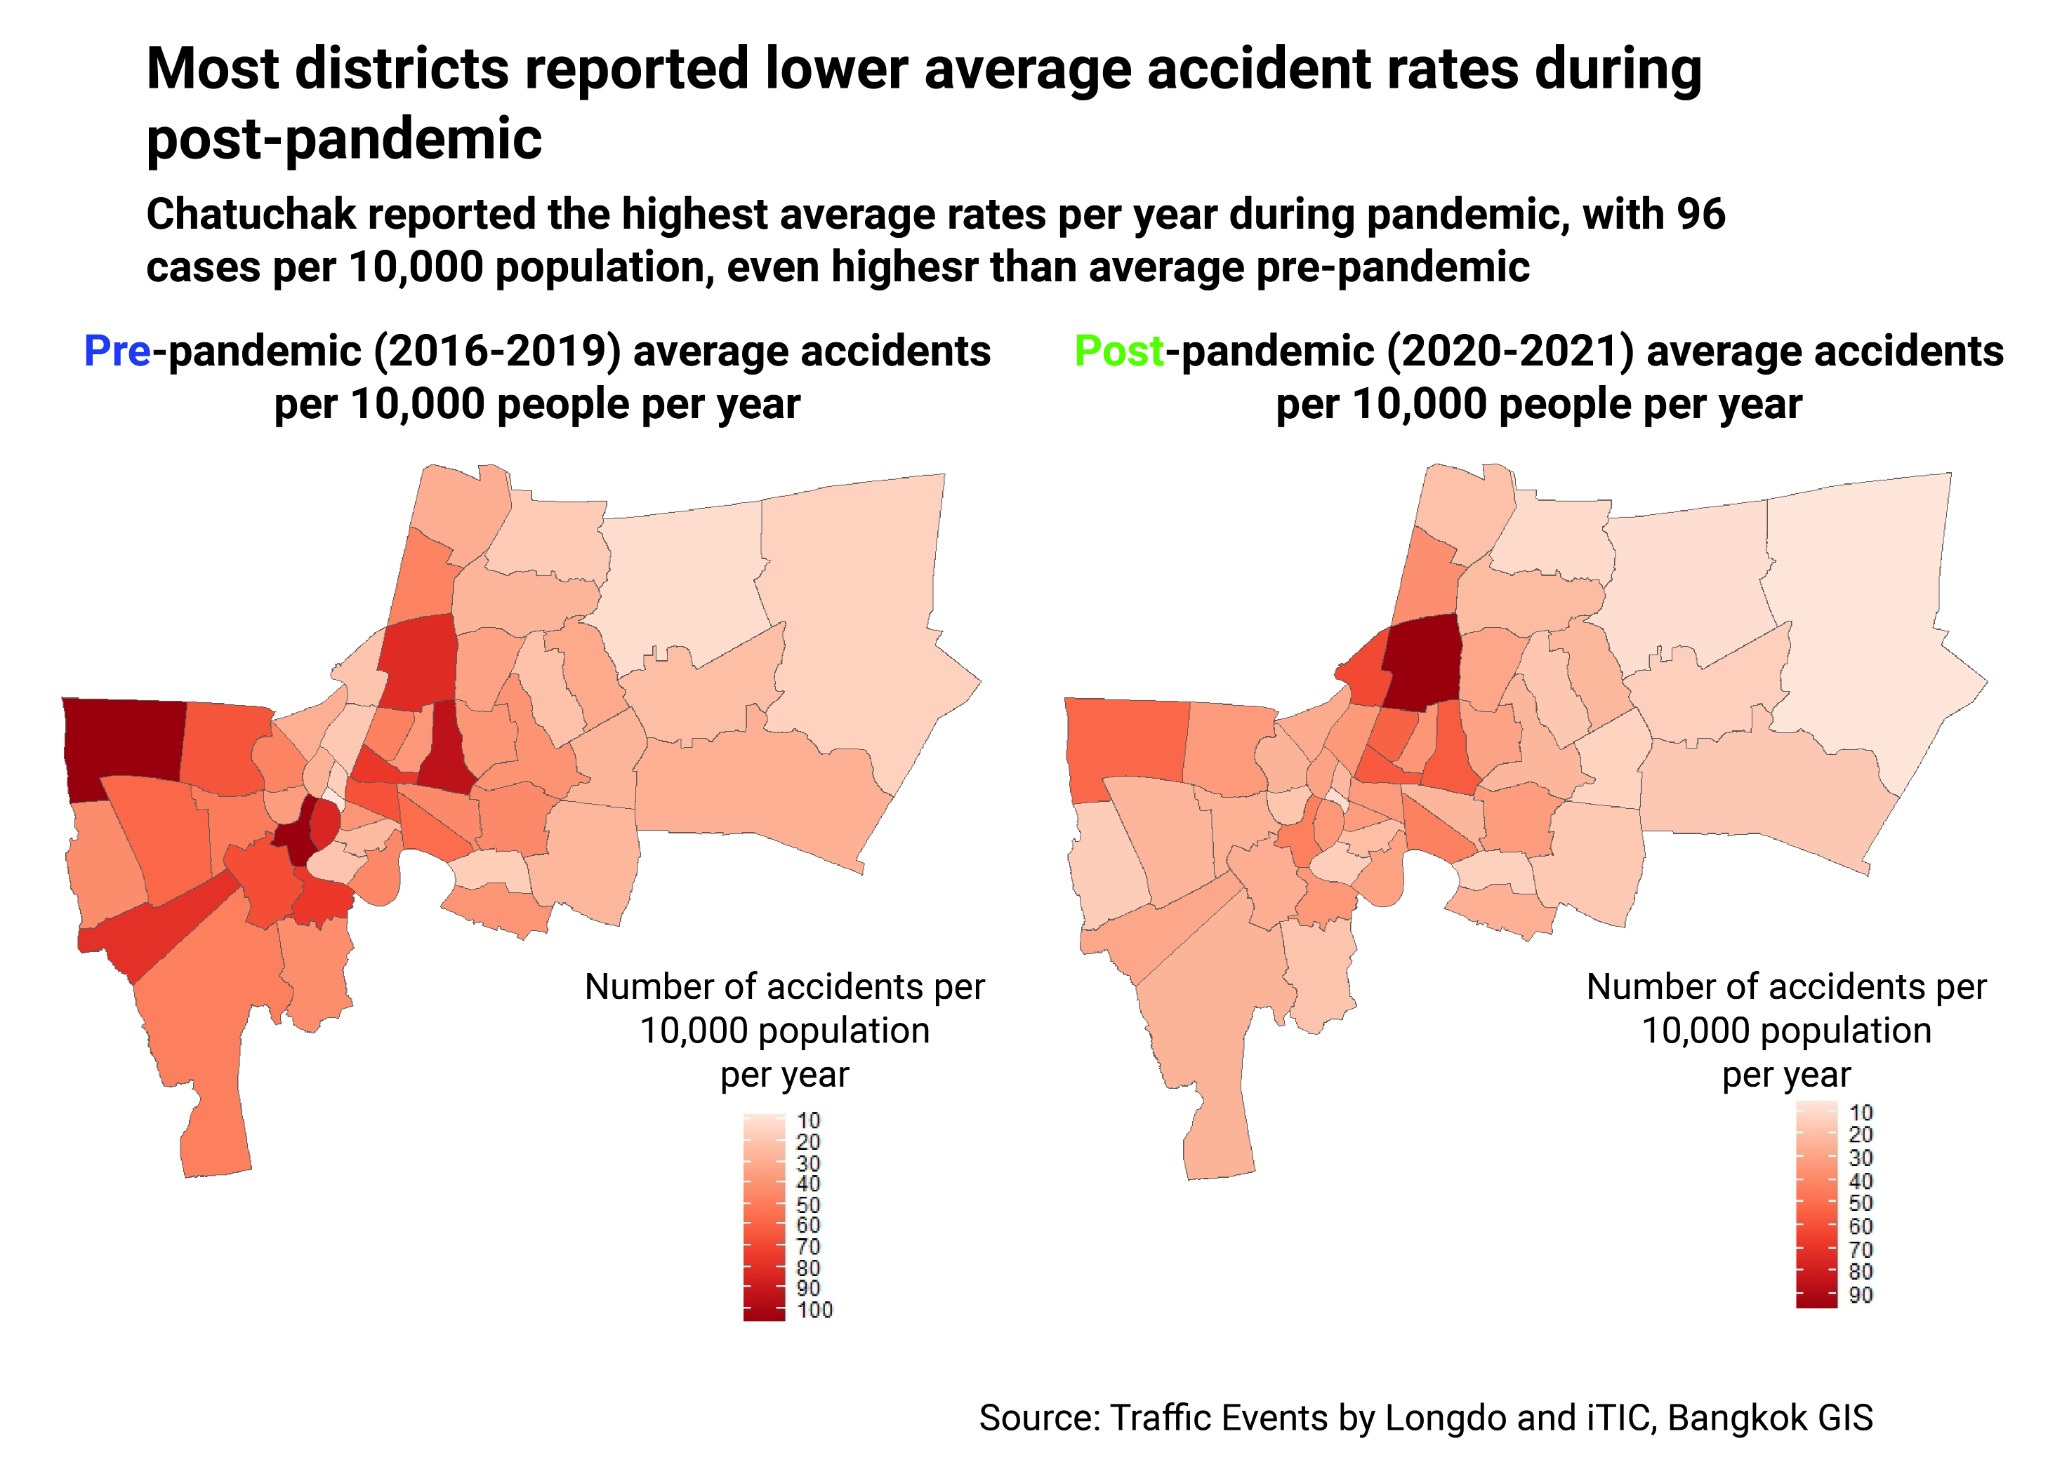
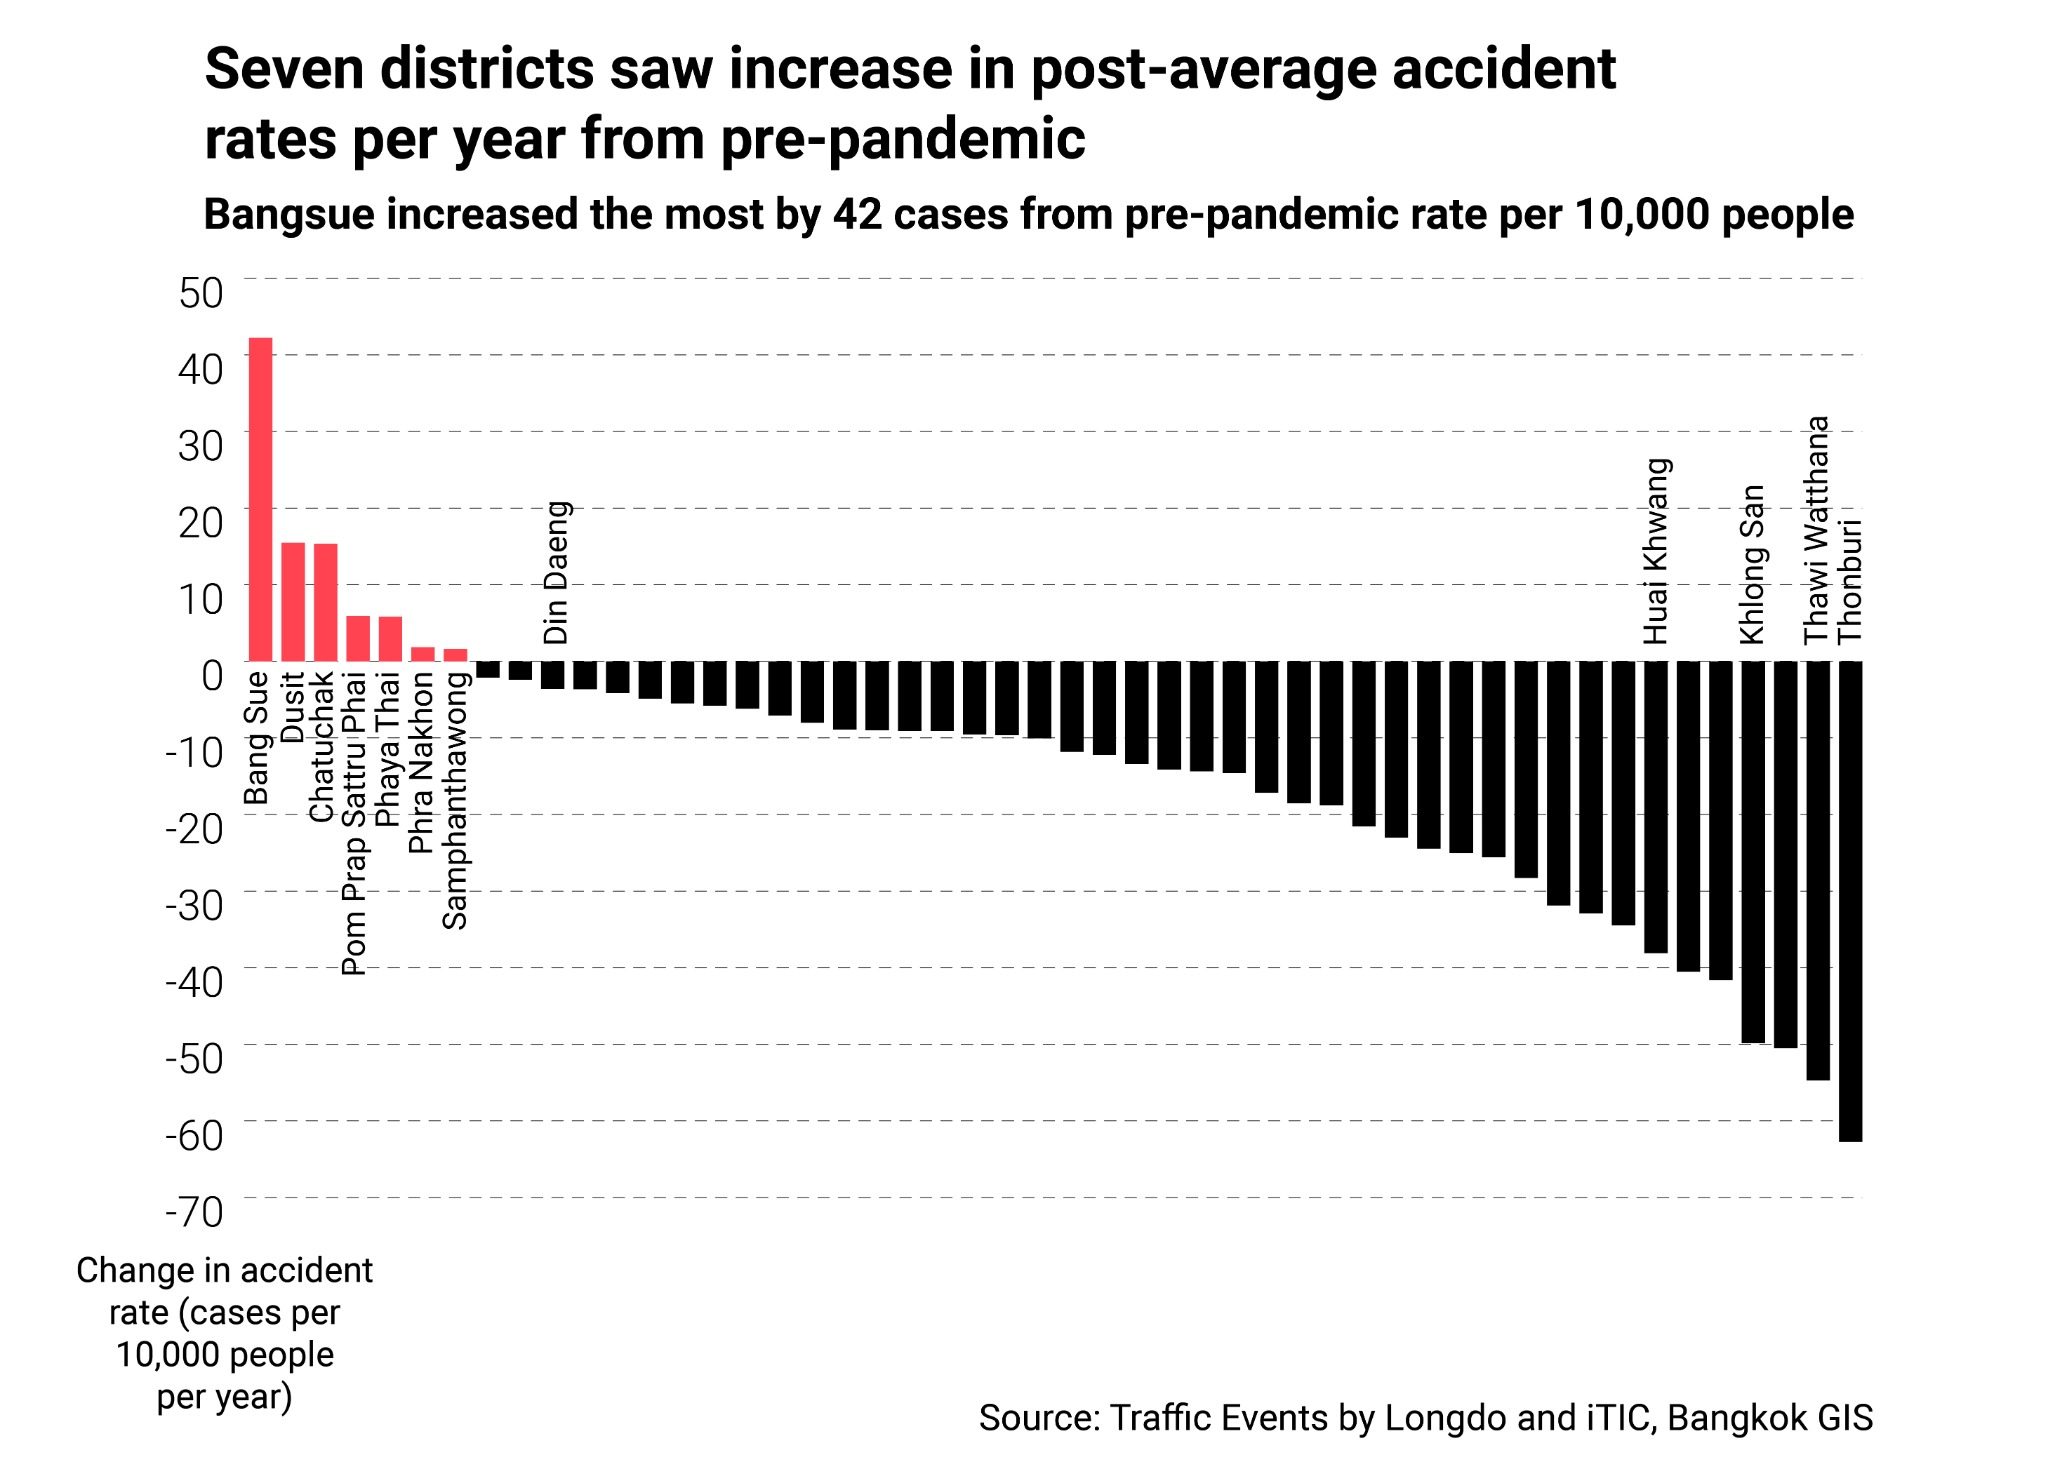
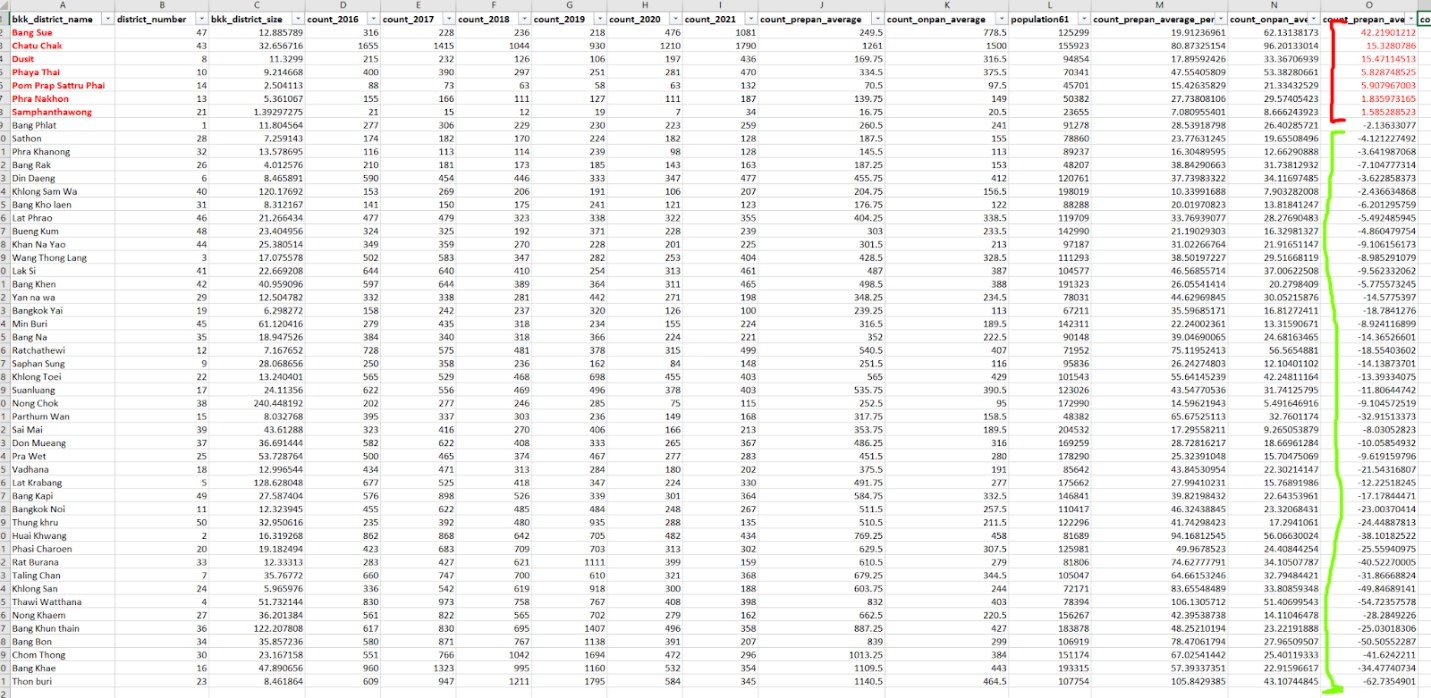
Regarding the pandemic, most districts report lower accident rates than pre-pandemic years, except seven districts - Bangsue, Dusit, Chatuchak, Prom Prap Sattru Phai, Phaya Thai, Phra Nakorn and Samphanthawong, all of which accident rates increase.
Bangsue made the highest change with 42 accident cases per 10,000 people per year, or 529 more accidents per year. Chatuchak and Dusit ranked next, with both increasing 15 accident cases per year, and 239 and 147 cases per year respectively.
Meanwhile, Chatuchak still reported the highest average accident rate per year in the post pandemic (2020-2021) with 96 cases per 10,000 population. Surprisingly, Khlong San and Thonburi, although reported in the top six districts with highest accident rates across six years, they saw a decrease by 49 and 62 in average post-pandemic rates.
Methodology
I mainly doing data analysis with R language through R Studio, while viewing sample results on Excel, and visualizing with Adobe Illustrator.
1) How many accidents are there across 50 districts in Bangkok from 2016 to 2021?
At the beginning, I got datasets of traffic events between 2012 to 2022 in Thailand, including heavy traffic, constructions and accidents, from Longdo Traffic platform. The data was reported by real time users via local radio stations, and insurance companies, and all collected by The Intelligent Traffic Information Center Foundation (iTIC) for Longdo.
Pattara Kiatisevi, manager at Longdo Traffic said that these datasets are collected with volunteer efforts, thus, the limitation is that they are not an official government datasets. From initial inspection, I recognized the consistency of data reporting from 2016 until 2021 as the report gathered data from new sources.
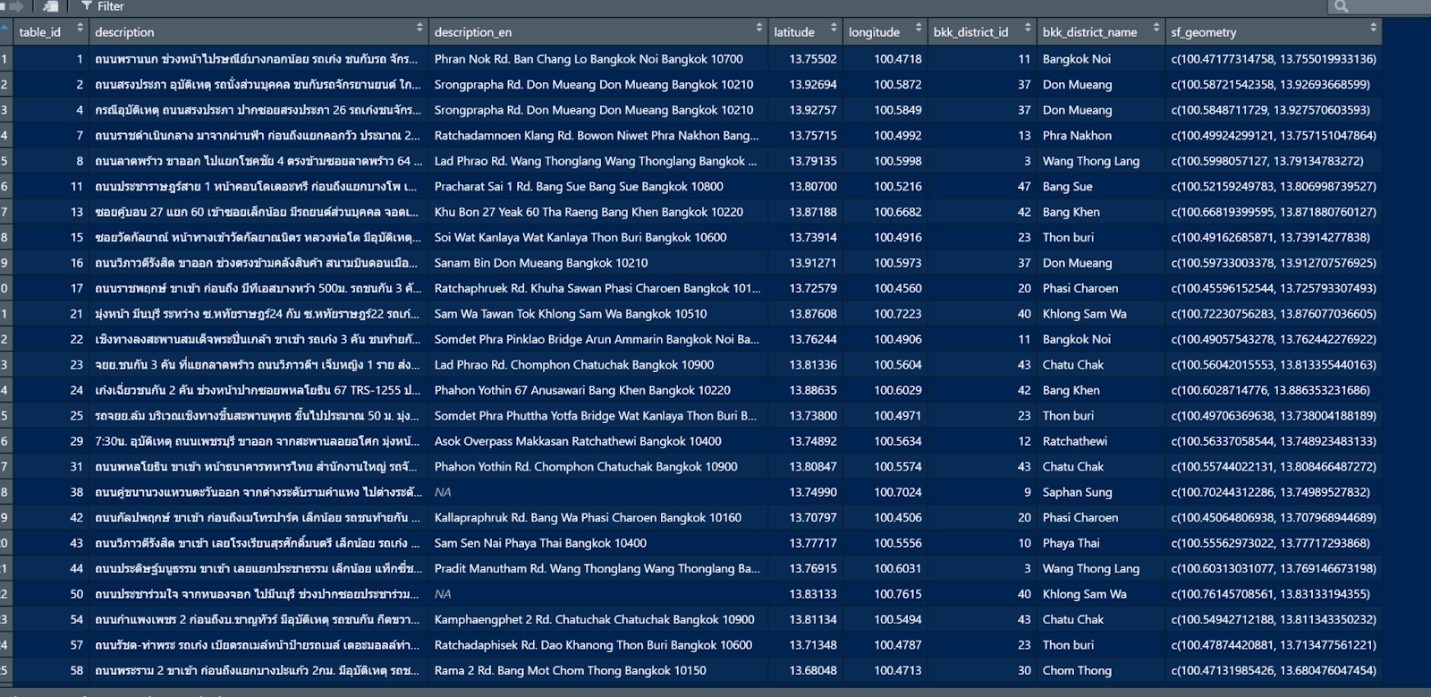
To get only accidents from Bangkok, the capital of Thailand, first I filtered for only the accident category from the main dataset, and flag them separately to each year. Each dataset for each year comes with Thai event description, English description, and coordinates. It is also clear that the dataset did not report numbers of people involved, numbers of fatalities, numbers of vehicles involved.
After that, I use a Bangkok shapefile with 50 districts inside from Bangkok GIS, as a base to filter for how many accidents each year fall into each district in Bangkok, through matching coordinates (latitude and longitude) to the Bangkok shapefile. I was able to count out the accident numbers by SF package, primarily ‘st_contains()’ that help flag coordinates within a specific polygon.
As a result, I initially got six lists, each with 50 unique IDs of Bangkok districts, the number of reported cases, and also the unique IDs of cases
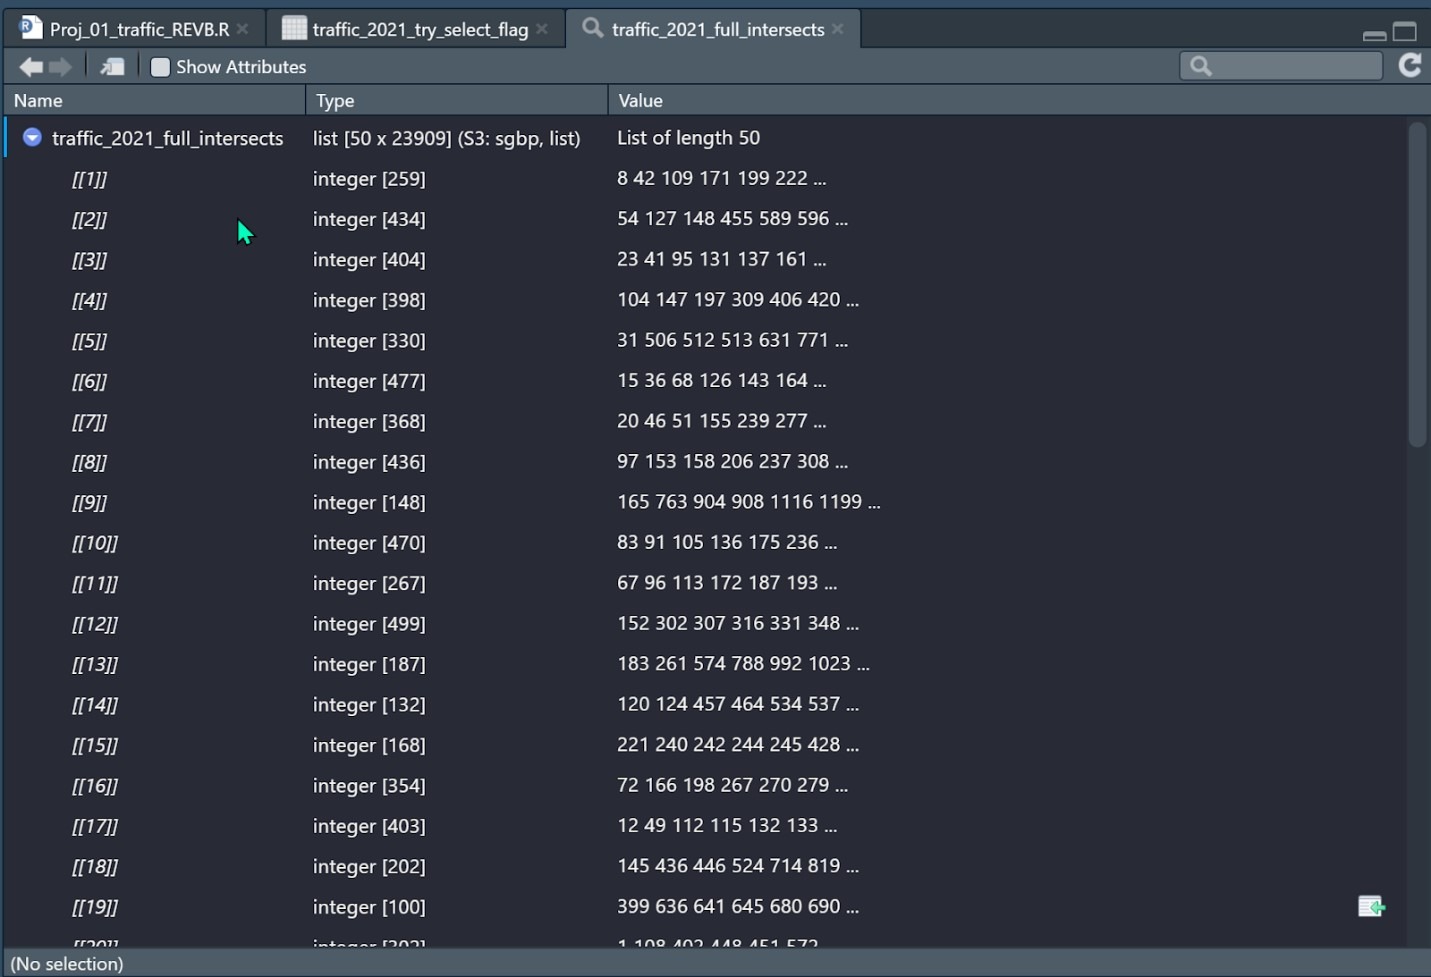
After that, I was able to transform it into a dataframe and flag each case back to each year’s reported accident data. As a result, I achieve a clean record level data that contains only Bangkok accidents with coordinates, along with district IDs and district names.
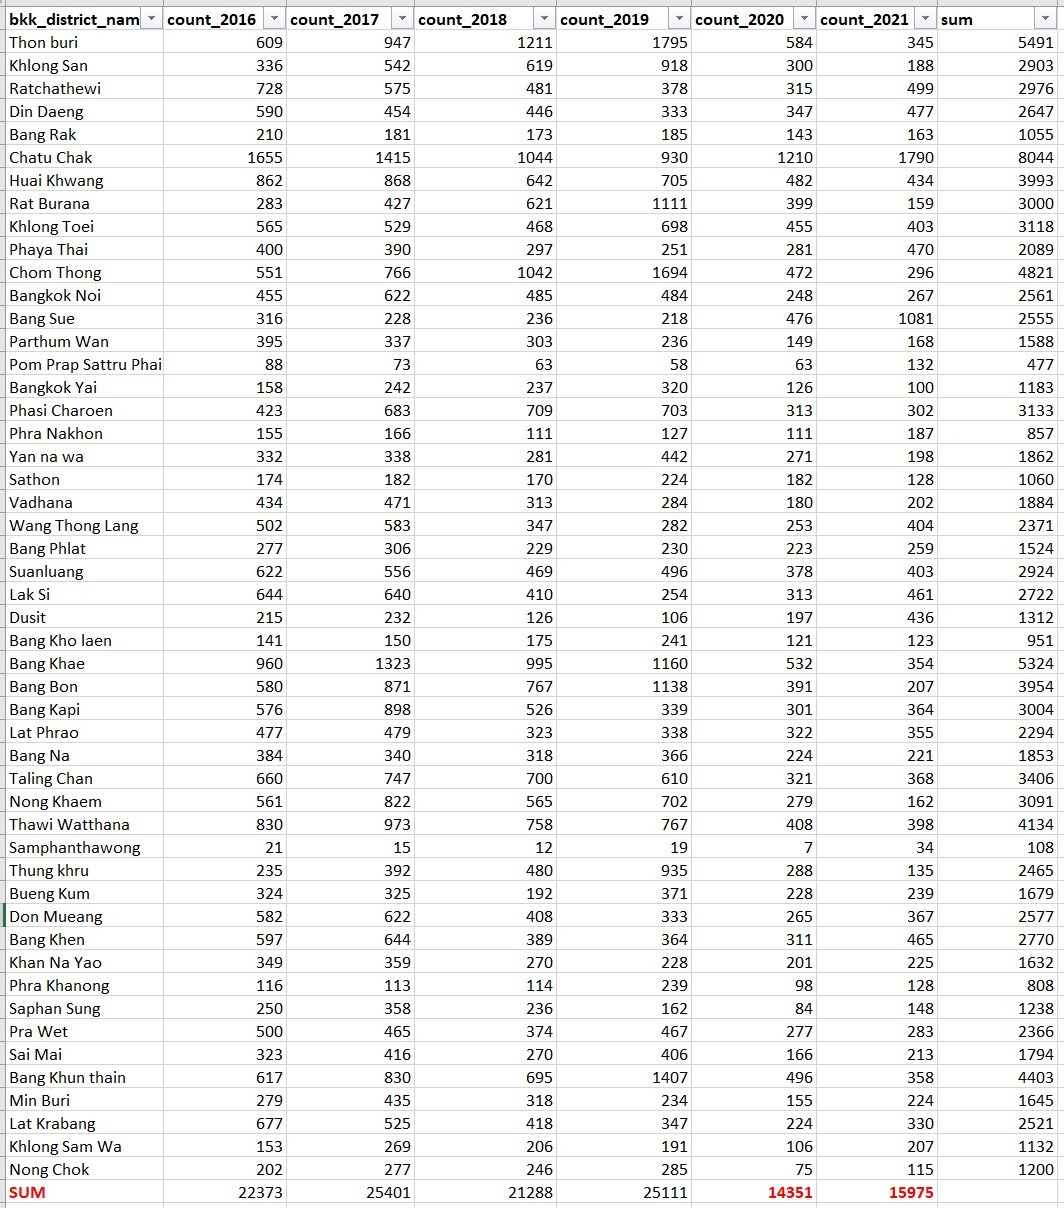
Now, I was able to count how many accidents are there in each district in each year, thus achieving summary level data, showing an accident trend across six years with summaries as follows.
2) Measuring the overall accident rates
In order to come up with a solid conclusion, I decided to find a reliable unit to measure the actual accident rate, that is comparable between each 50 districts. There are two measuring units I came up with; accidents per population and accidents per district area size.
To measure the rate of accidents per population, first, I need to download a Bangkok population dataset from the Digital Government Development Agency. Since the population number for each district stays pretty relatively constant over time, I decided to use the 2017 population as a base for calculation, as it is the only latest data available. Now with this data, and the previous summary level data reporting accident numbers for each district, I was able to calculate a solid accident rate - how many traffic accidents there are out of every 10,000 people in the past six years. I visualized the data with a choropleth map.
Likewise, to measure the rate of accidents per district size, first I need to get a district size in square meters or square kilometers. Luckily, it already came with the initial Bangkok shapefile. As a result, with this data and the previous summary level data reporting accident numbers for each district, I was able to calculate a solid accident rate - how many traffic accidents there are out of every 1 square kilometers in the past six years. I visualized the data with a choropleth map.
3) Measuring the most dangerous locations on map
In order to find out the most dangerous location with the most frequent accidents, I generate a heatmap with GGplot package, using Bangkok shapefile as a base and total accident spots across six years. After that, I manually lay out the heatmap on Bangkok satellite image, exported from mapscreator.io, which referenced data from OpenStreetMap. At the end, I know an overview of which road and district reported the densest accidents. This way is easier than my first attempt to match accident spots to Bangkok’s road shape file through computational analysis, which did not give an acceptable result.
4) Calculating vehicles involved
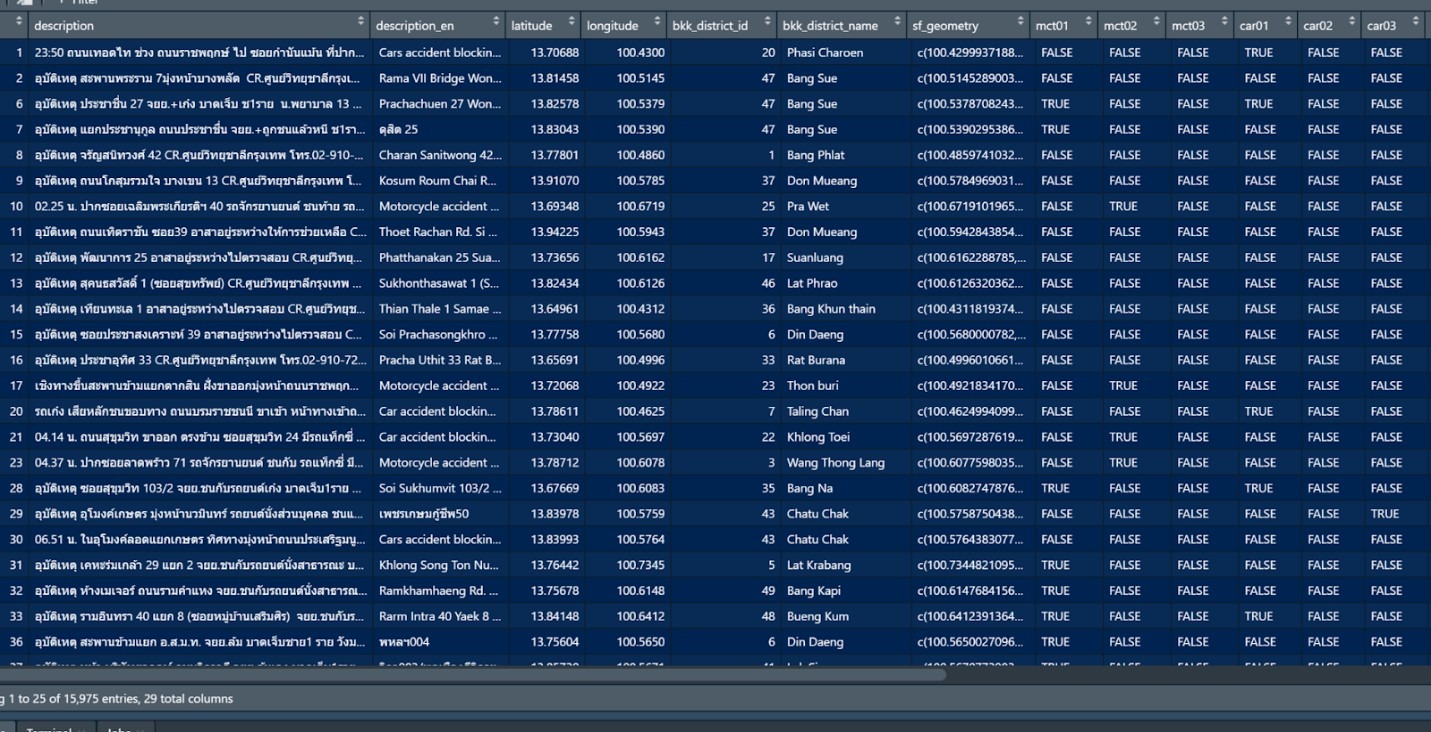
With the datasets I have, it’s also possible to calculate for types of vehicles involved for accidents reported each year. I used the string extract function, grepl() from StringI package to count for vehicle types, through matching Thai keywords to accident descriptions in the clean record level data from 2016 to 2021. These are Thai keywords “patterns” for each vehicle types:
-personal car (keyword: เก๋ง/ส่วนบุคคล/ส่วนตัว)
-motorcycle (keyword: จักรยานยนต์/มอเตอร์ไซค์)
-pickup truck (keyword: กระบะ)
-truck (keyword: บรรทุก)
-taxi (keyword: แท็กซี่/แท๊กซี่)
-bus (keyword: ประจำทาง/เมล์)
There is an important limitation as some cases did not report vehicle types. In that situation, I collected the data as NAs. Also, each case only specifies the vehicle types involved, not the number of them. So, at the end, the summary vehicle only reports a percentage out of total reported case each year.
5) Calculating change in accident rates from pre-pandemic (2016-2019) to post-pandemic(2020-2021)
With the current summary level data of 50 districts, their accident number each year (2016-2021), and district population number, now that I can calculate the accident rate per population per separate year. But, my question is to compare between average pre-pandemic year and average post-pandemic year, to see how the trend of accident rate per district is. From that, first I need to calculate average accident number for pre-pandemic(sum all 2016-2019 divided by 4) and post pandemic(sum all 2020-2021) first, and after that divided by population and times 10,000 to get two rates. Finally, make a subtraction between the two rate to get whether positive change or negative change.
Post a comment